

Mastering the Map: How to Read the Explore Fall Forecast Like a Foliage Pro
Turn the latest foliage forecast into your best-timed autumn trip
August 7, 2026
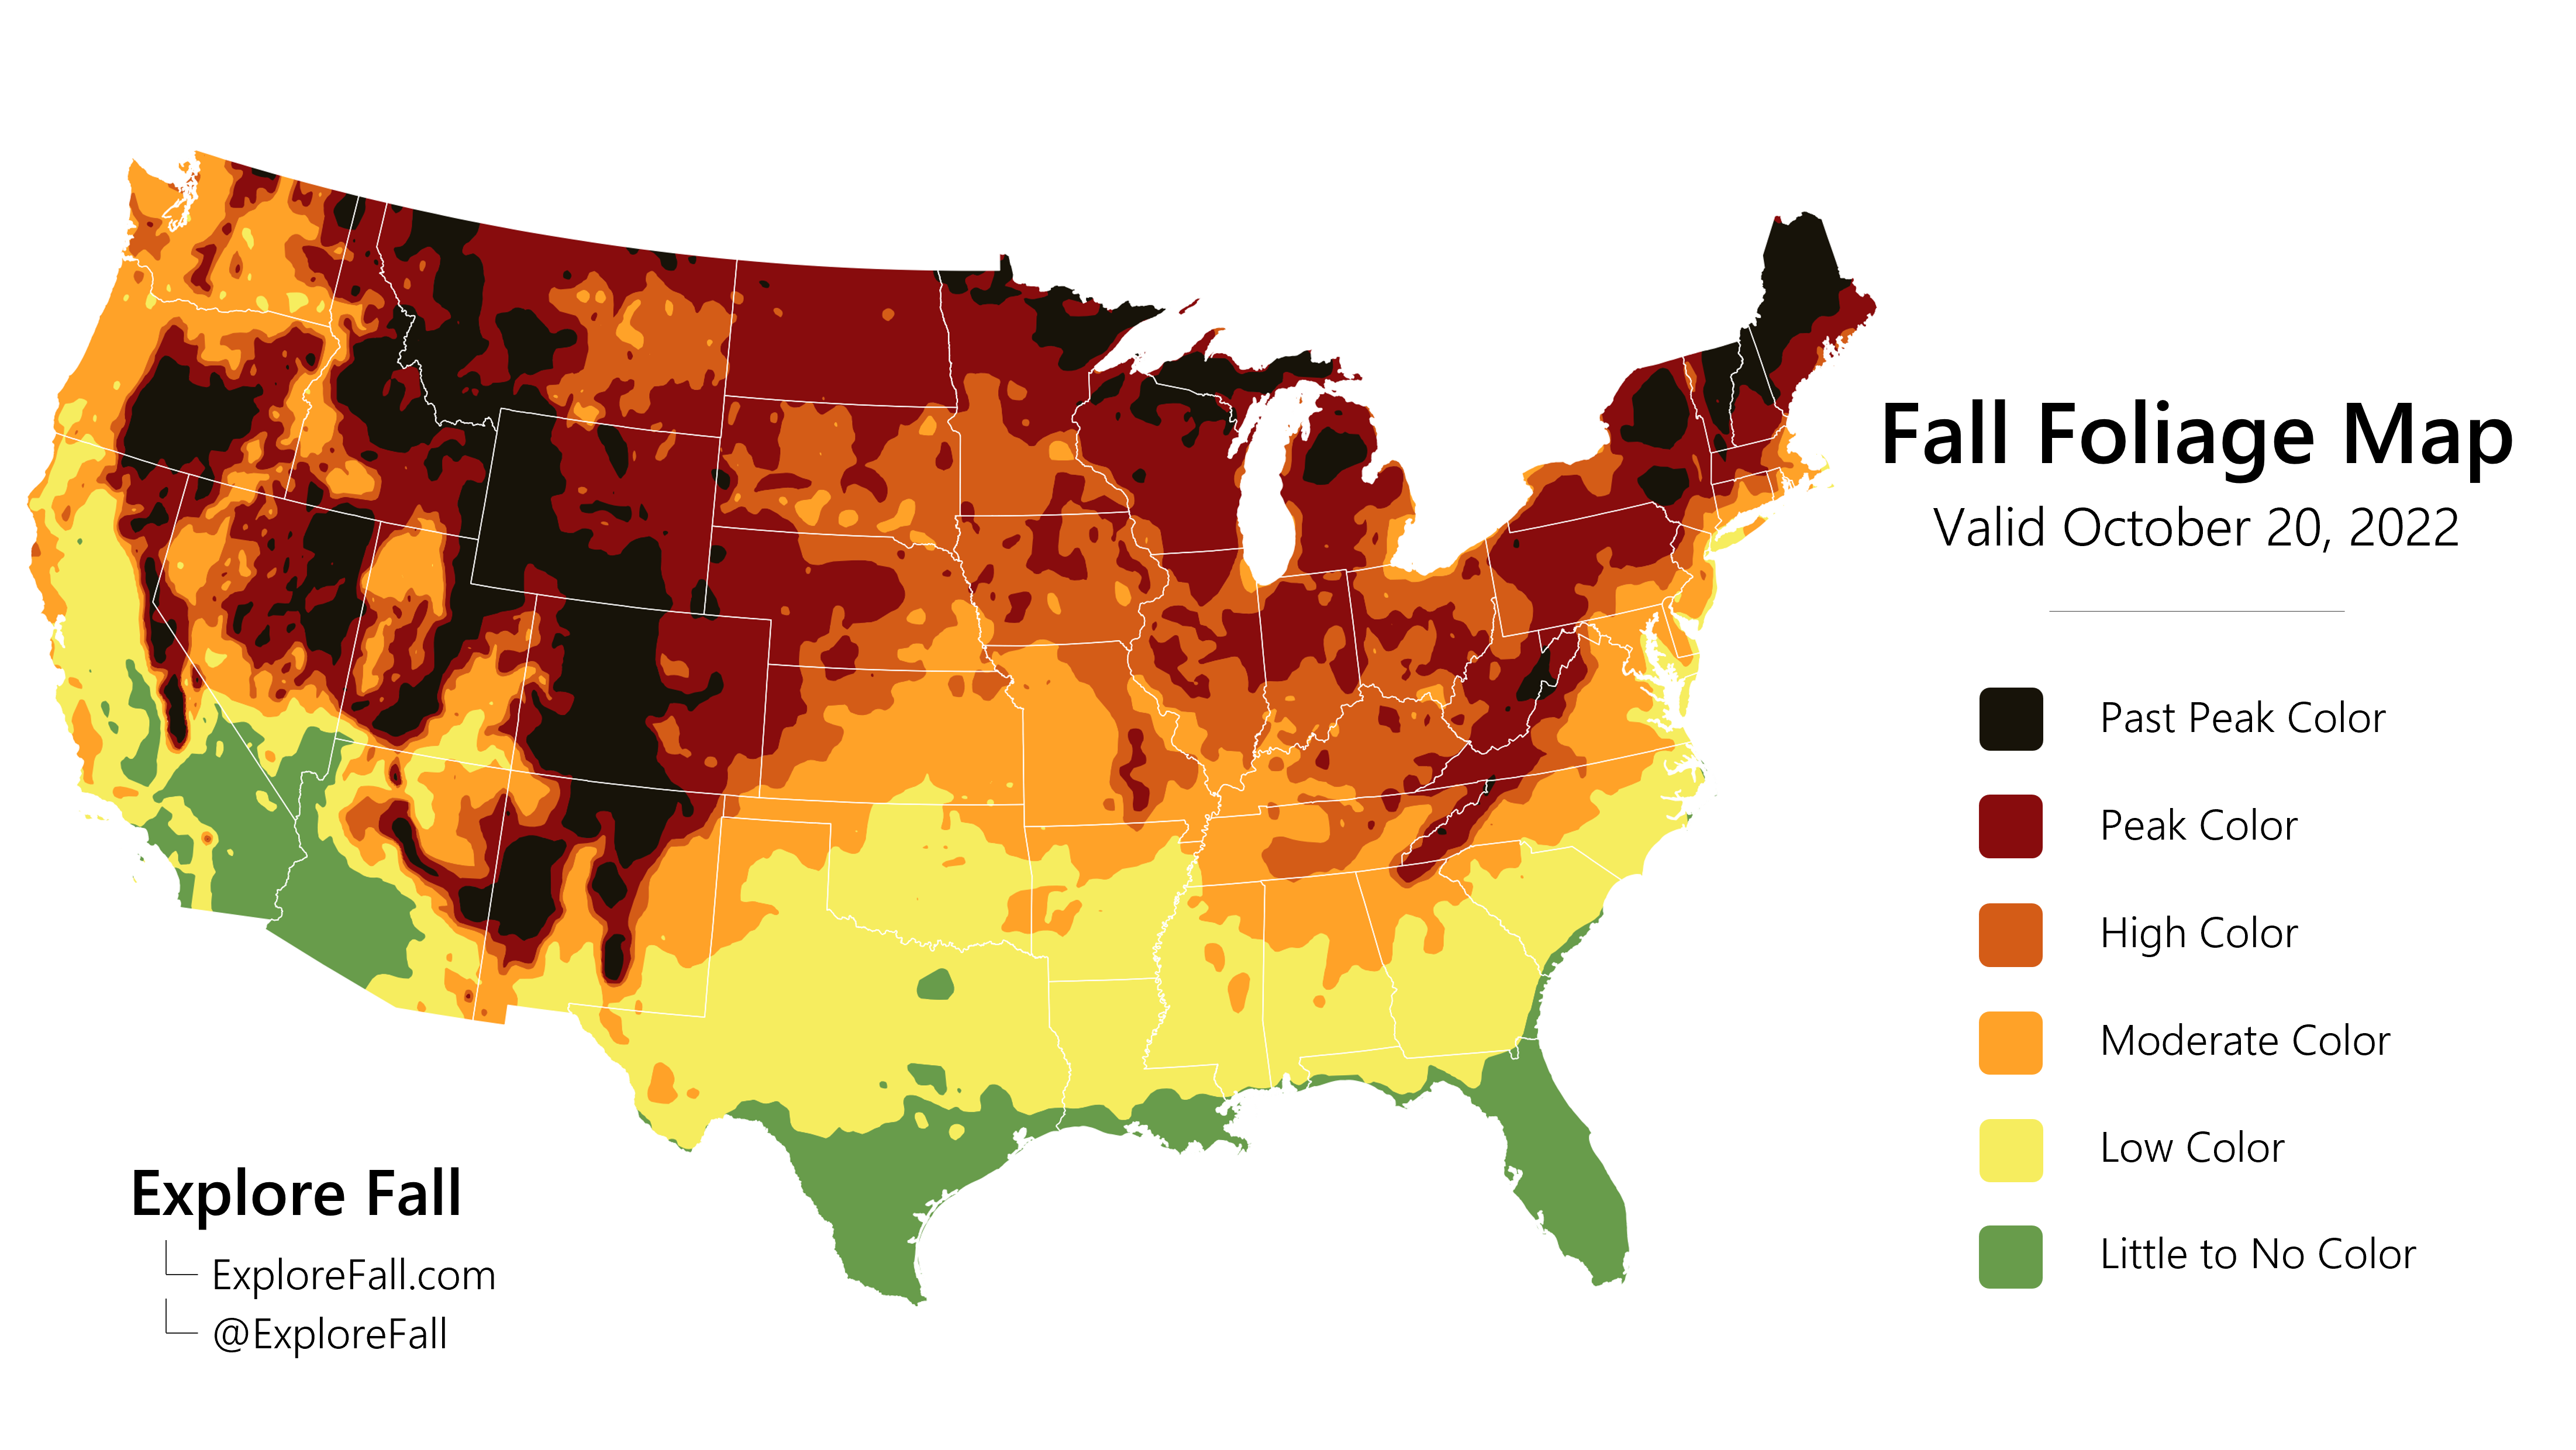
The Explore Fall interactive map is designed to help you plan for and track fall foliage. Whether you are choosing a weekend destination, checking the outlook for a favorite hike, or following the season across the country, the map turns a complex forecast into an easy-to-read view of current and upcoming color.
We have carefully built several features into the map to help you find the right place at the right time. This guide explains what each color category means and how to use the forecast, reports, search, and resolution controls like a foliage pro.
Understanding the Color Categories
The map is divided into color categories. Each category describes how widespread fall color is across a particular area. In general, greens and yellows mean the landscape still contains more green, while oranges and reds indicate that fall color is becoming more widespread.
Our mathematical model runs across the entire United States and calculates a pixel-by-pixel estimate of color. The model behind the forecast is complex, but the result is simple: each pixel receives a percentage of color. Here is what those percentages mean.
Little to No Color: 0%–10%
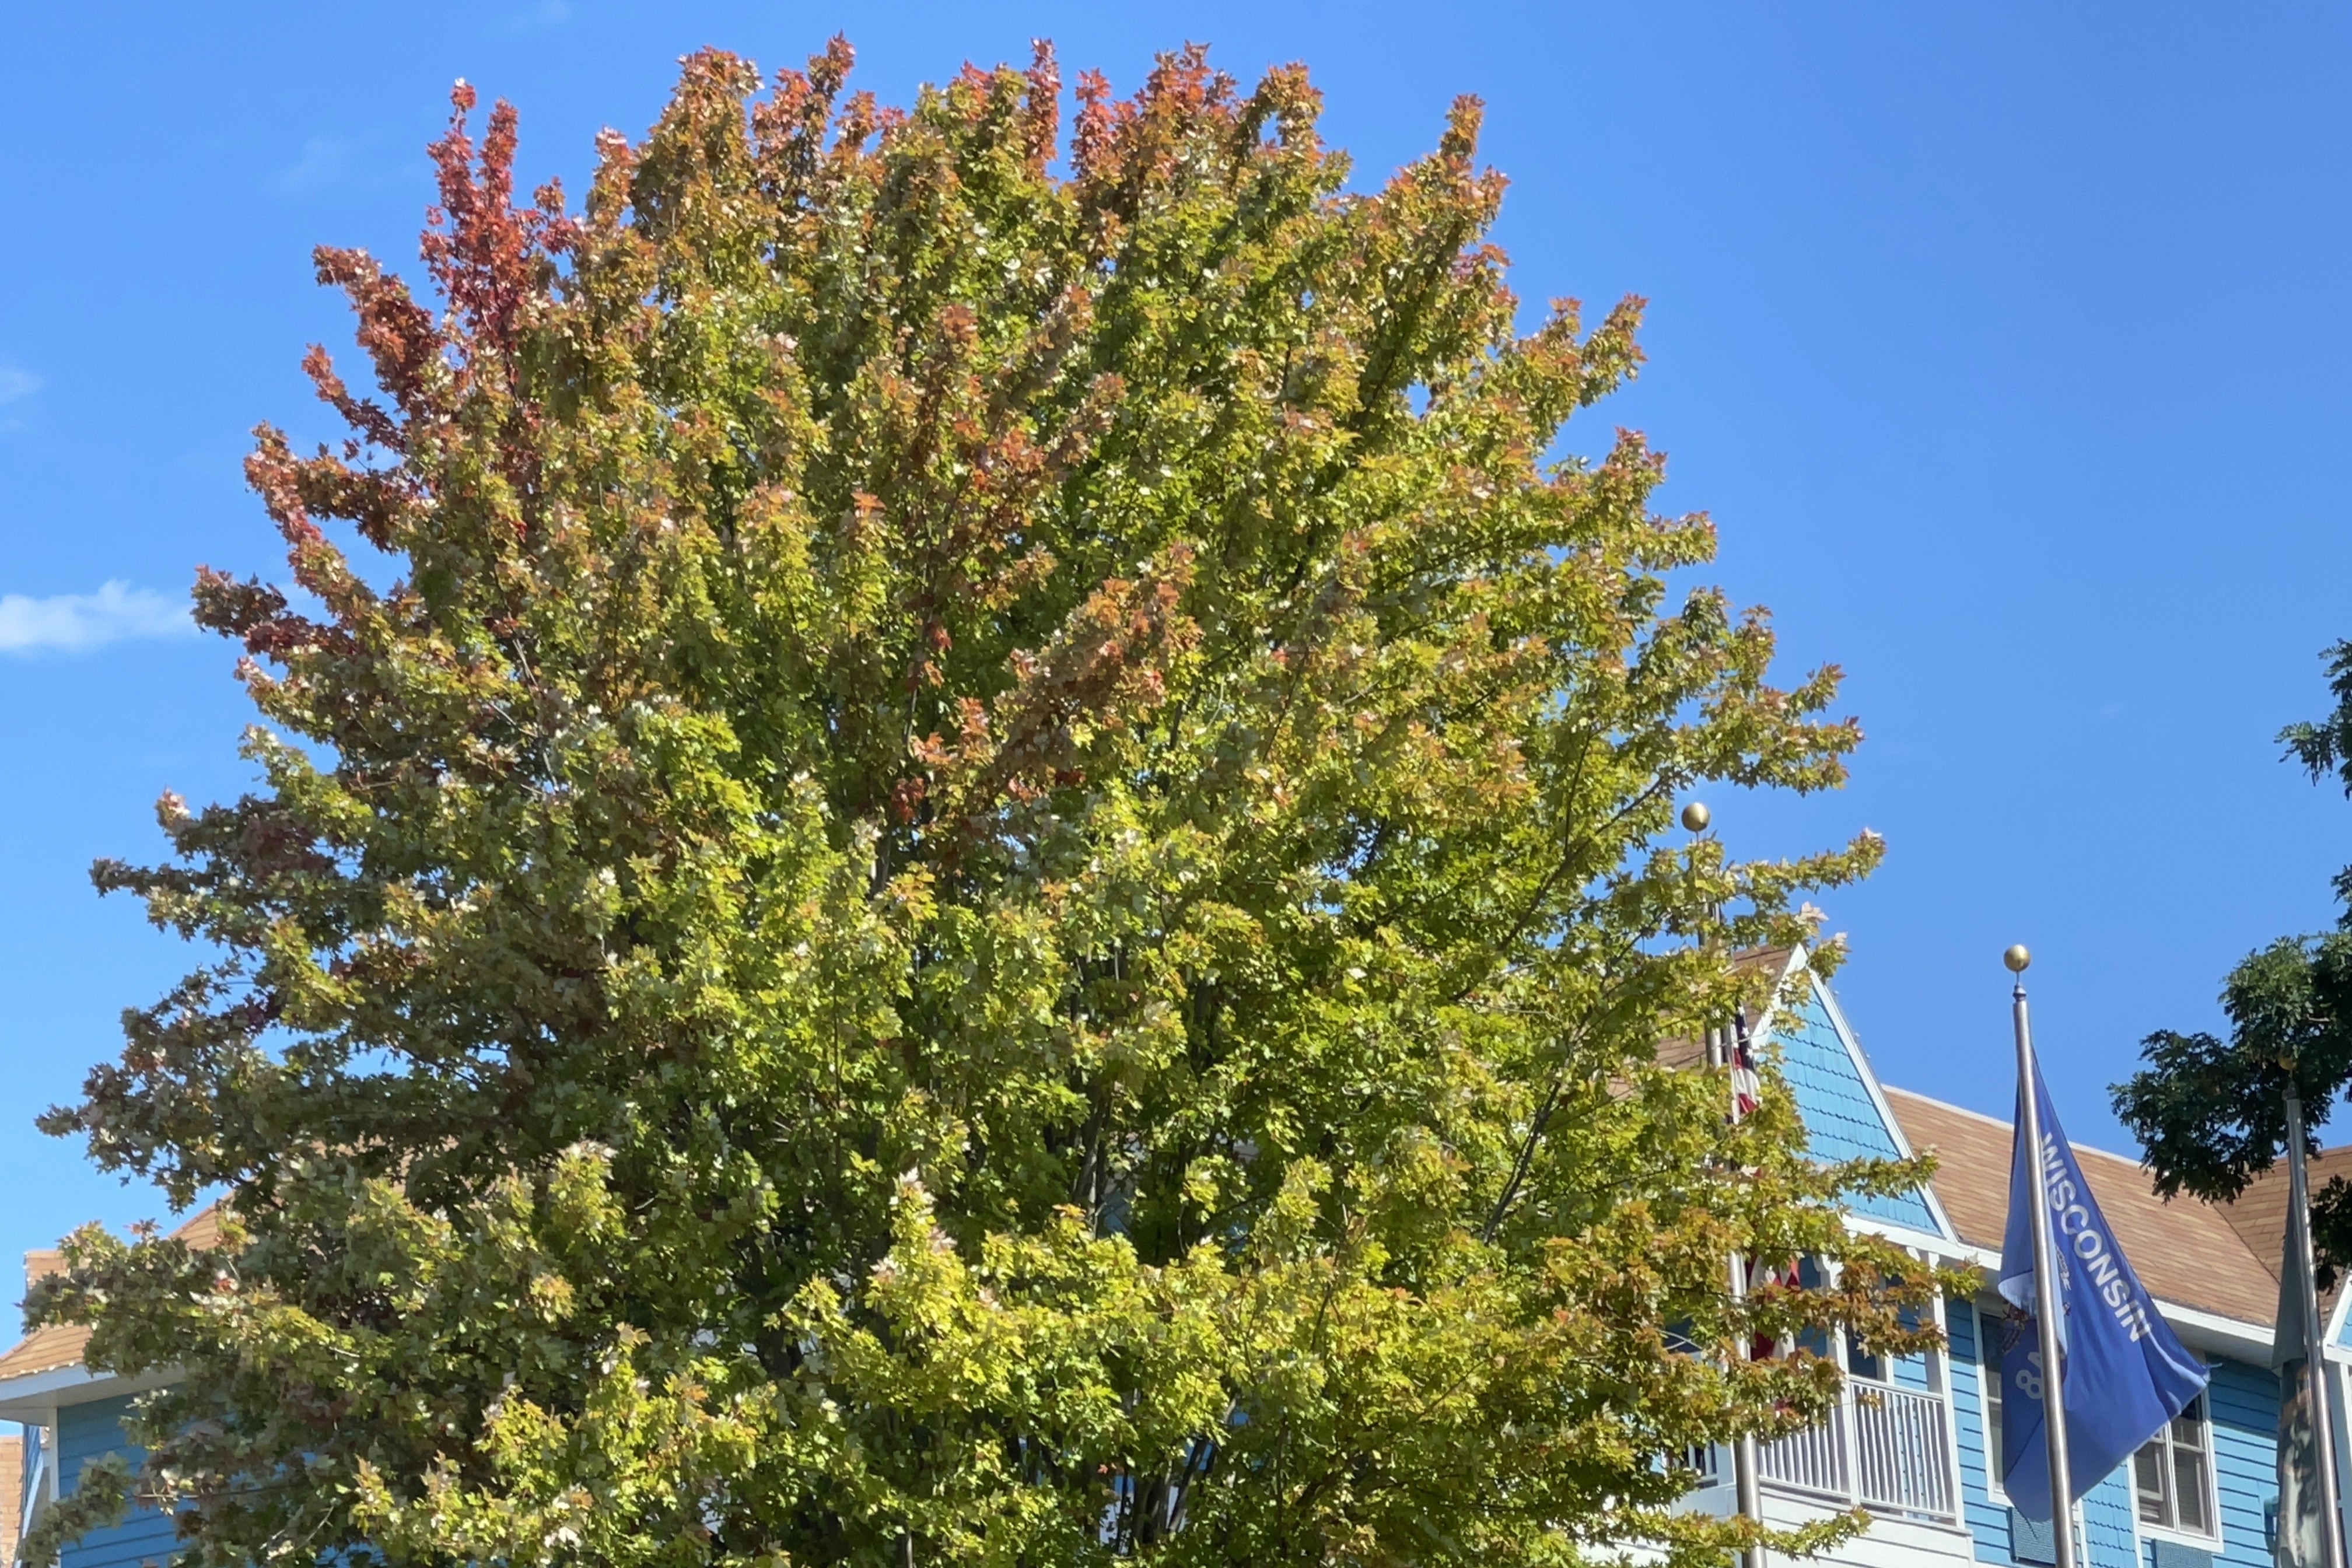
Green is still the predominant color, and either no trees or very few trees have begun changing. Every area starts the season at 0% as it comes out of the summer growing season. You may notice scattered color in late summer when individual trees are stressed or begin changing early. A few early red maples, roadside trees, and parking-lot trees may exhibit more advanced color in the late summer. This is usually a result of stressed trees and is related to heat and growing conditions. It is therefore not considered part of true autumn foliage development and qualifies as Little to No Color. Even true autumn foliage development across < 10% of the landscape is still considered Little to No Color.
Low Color: 10%–25%
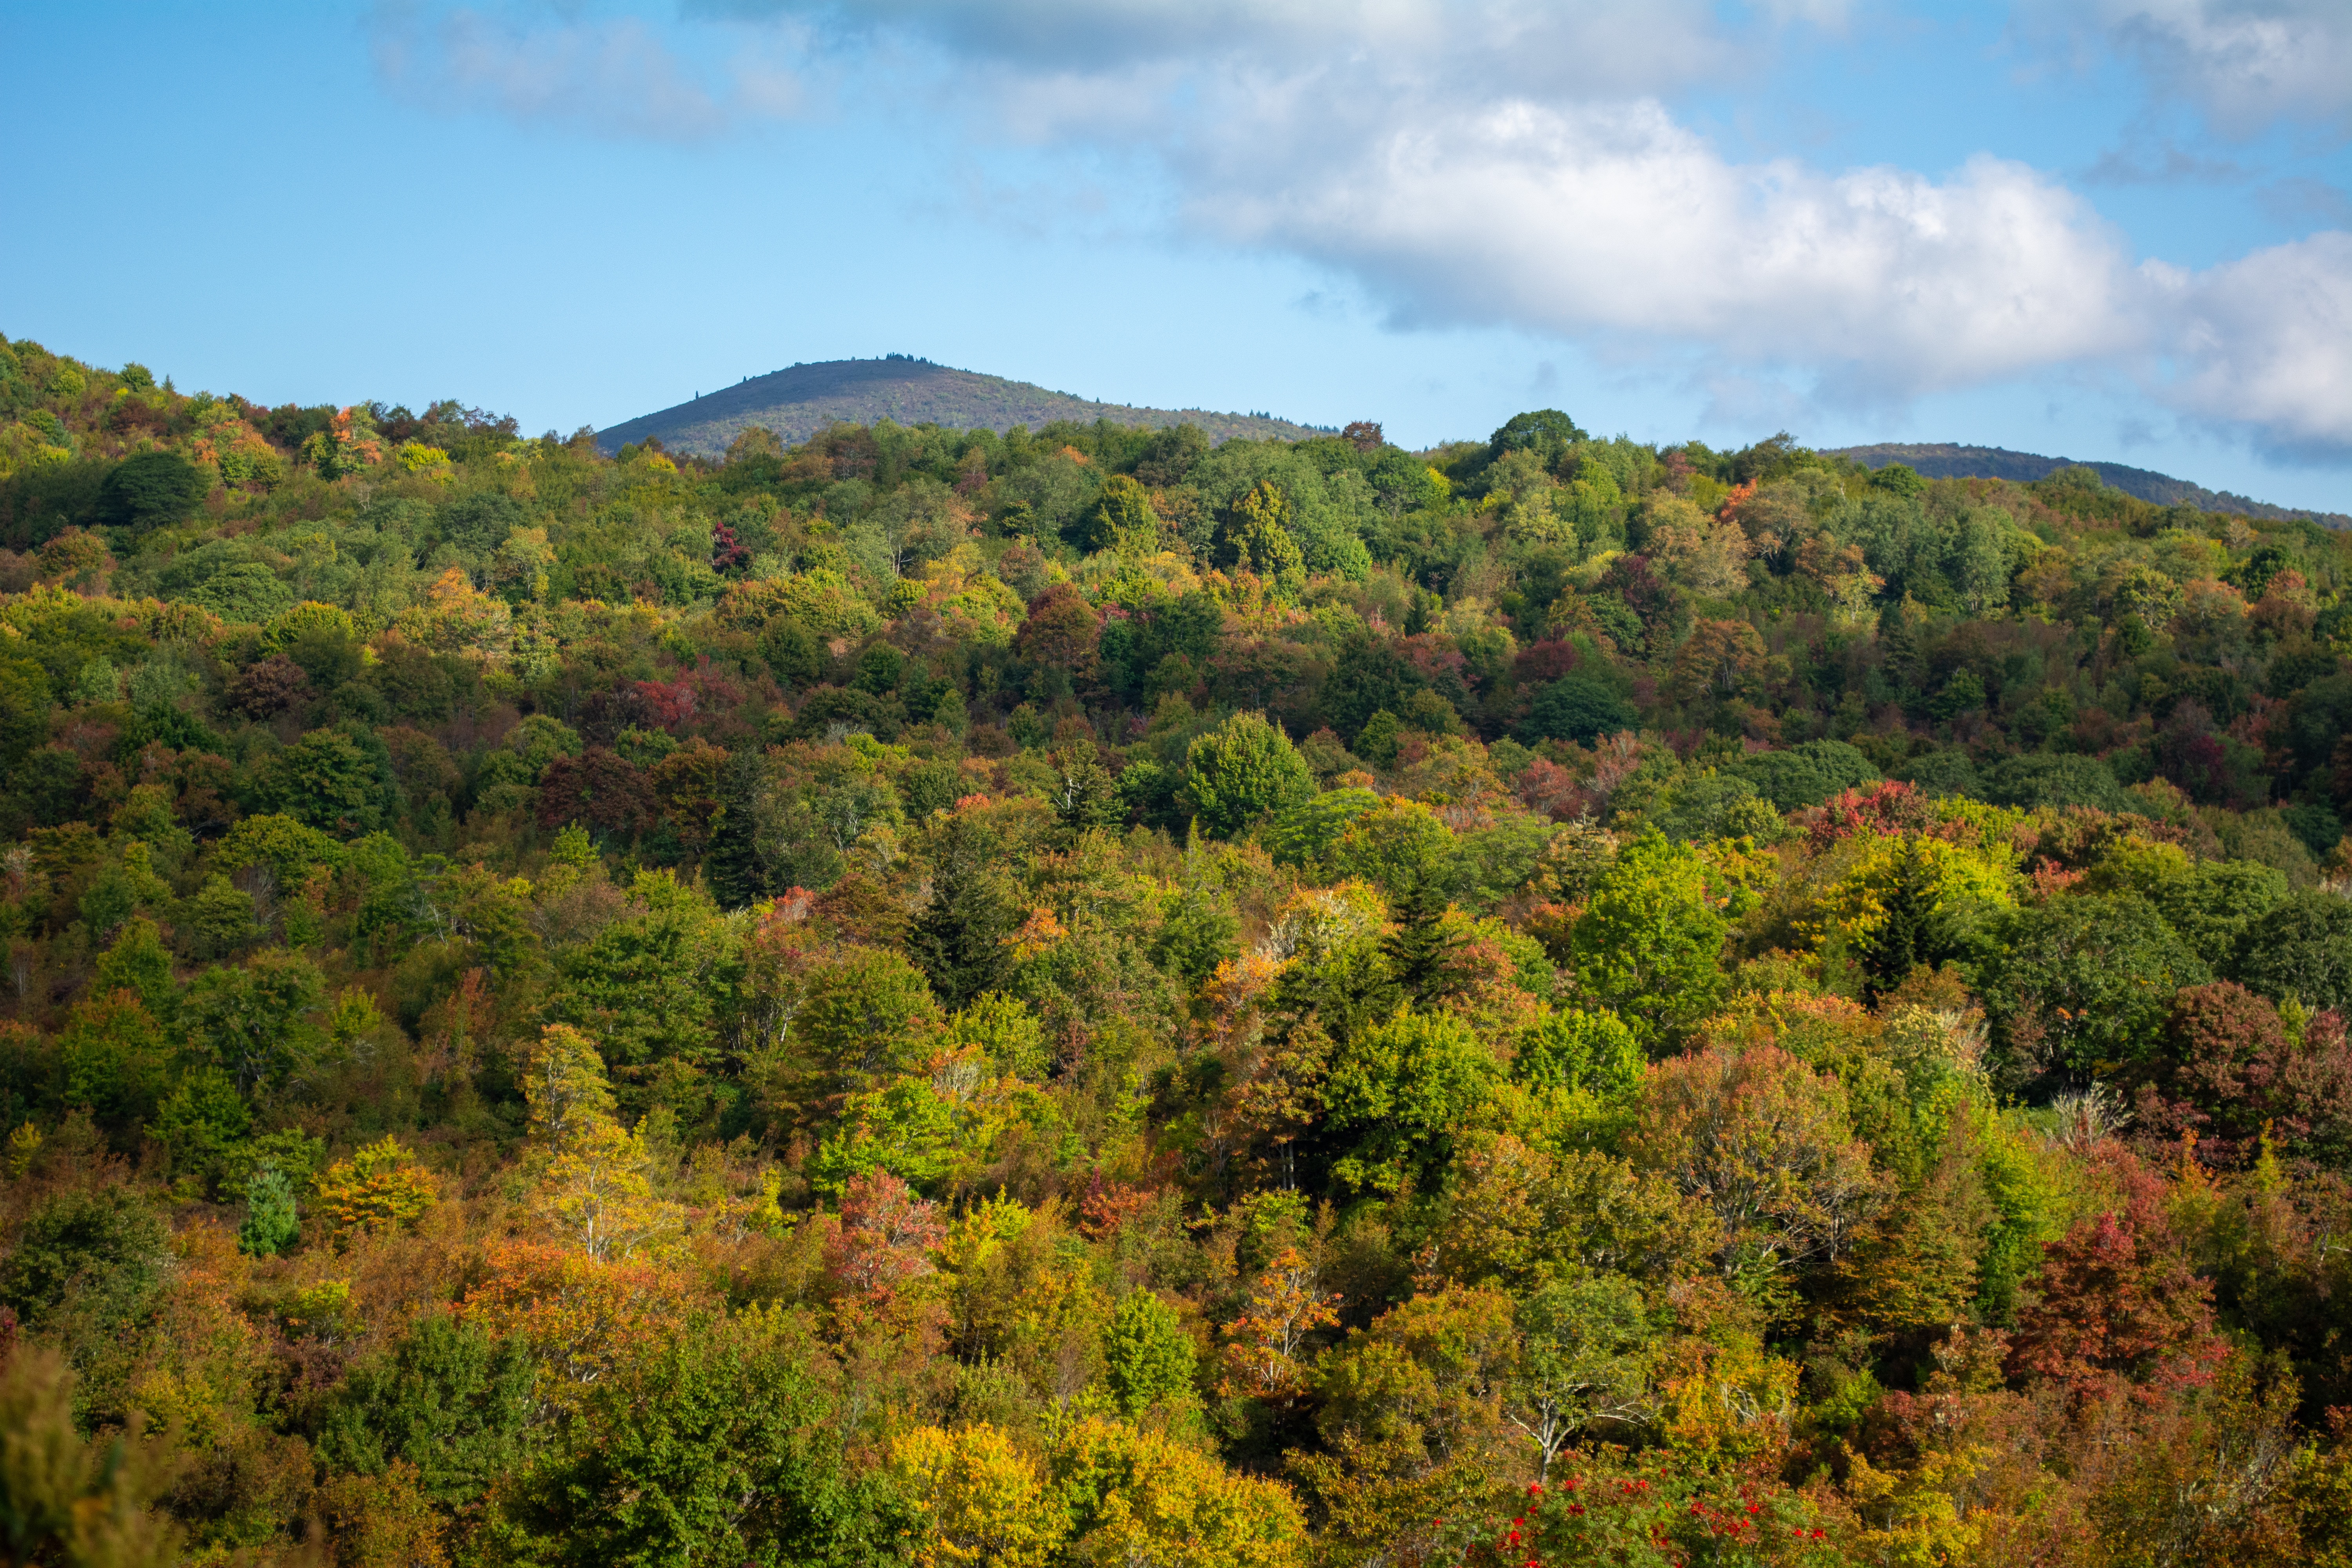
This is when the transition to fall becomes noticeable. More than a few isolated trees are changing: wider swaths of trees and forests begin turning together. Look for bright patches appearing across hillsides and street trees changing quickly.
Moderate Color: 25%–50%
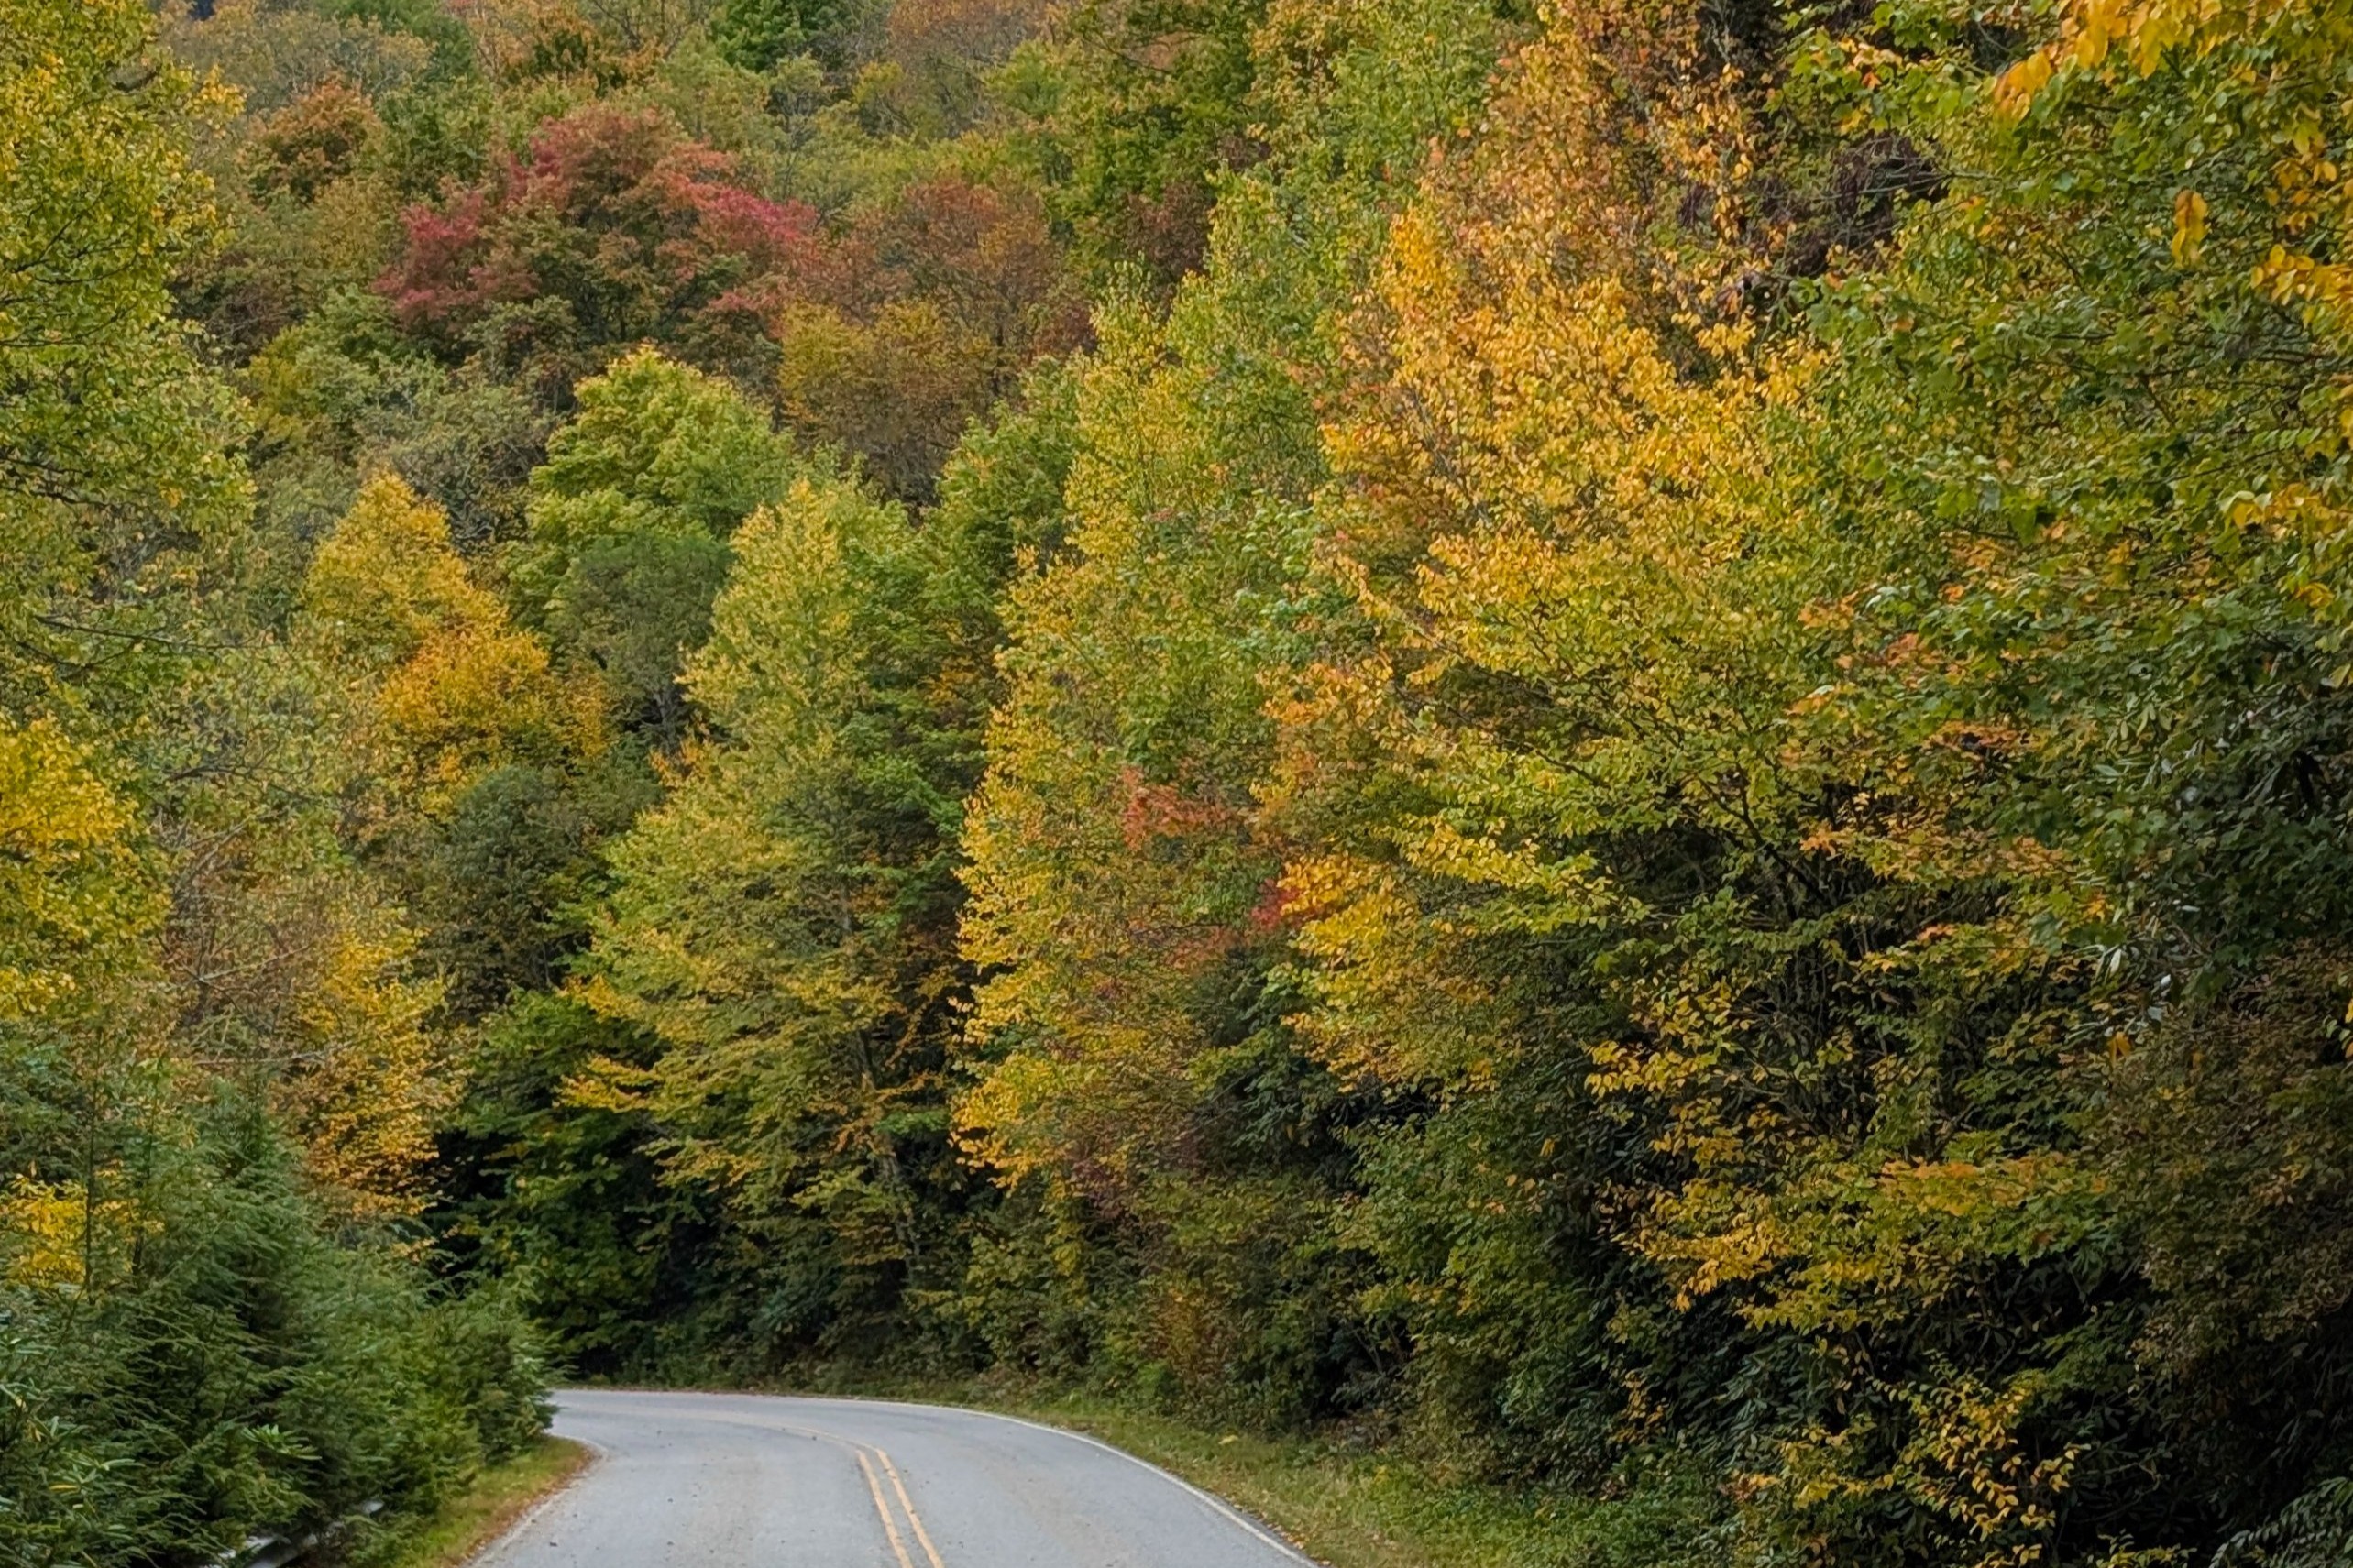
Fall color is now established across the landscape, although green remains an important part of the view. This stage often produces a varied mix of green, yellow, orange, and early red. It is a good time to visit if you enjoy multicolored scenery or want to get ahead of peak-season crowds.
High Color: 50%–75%
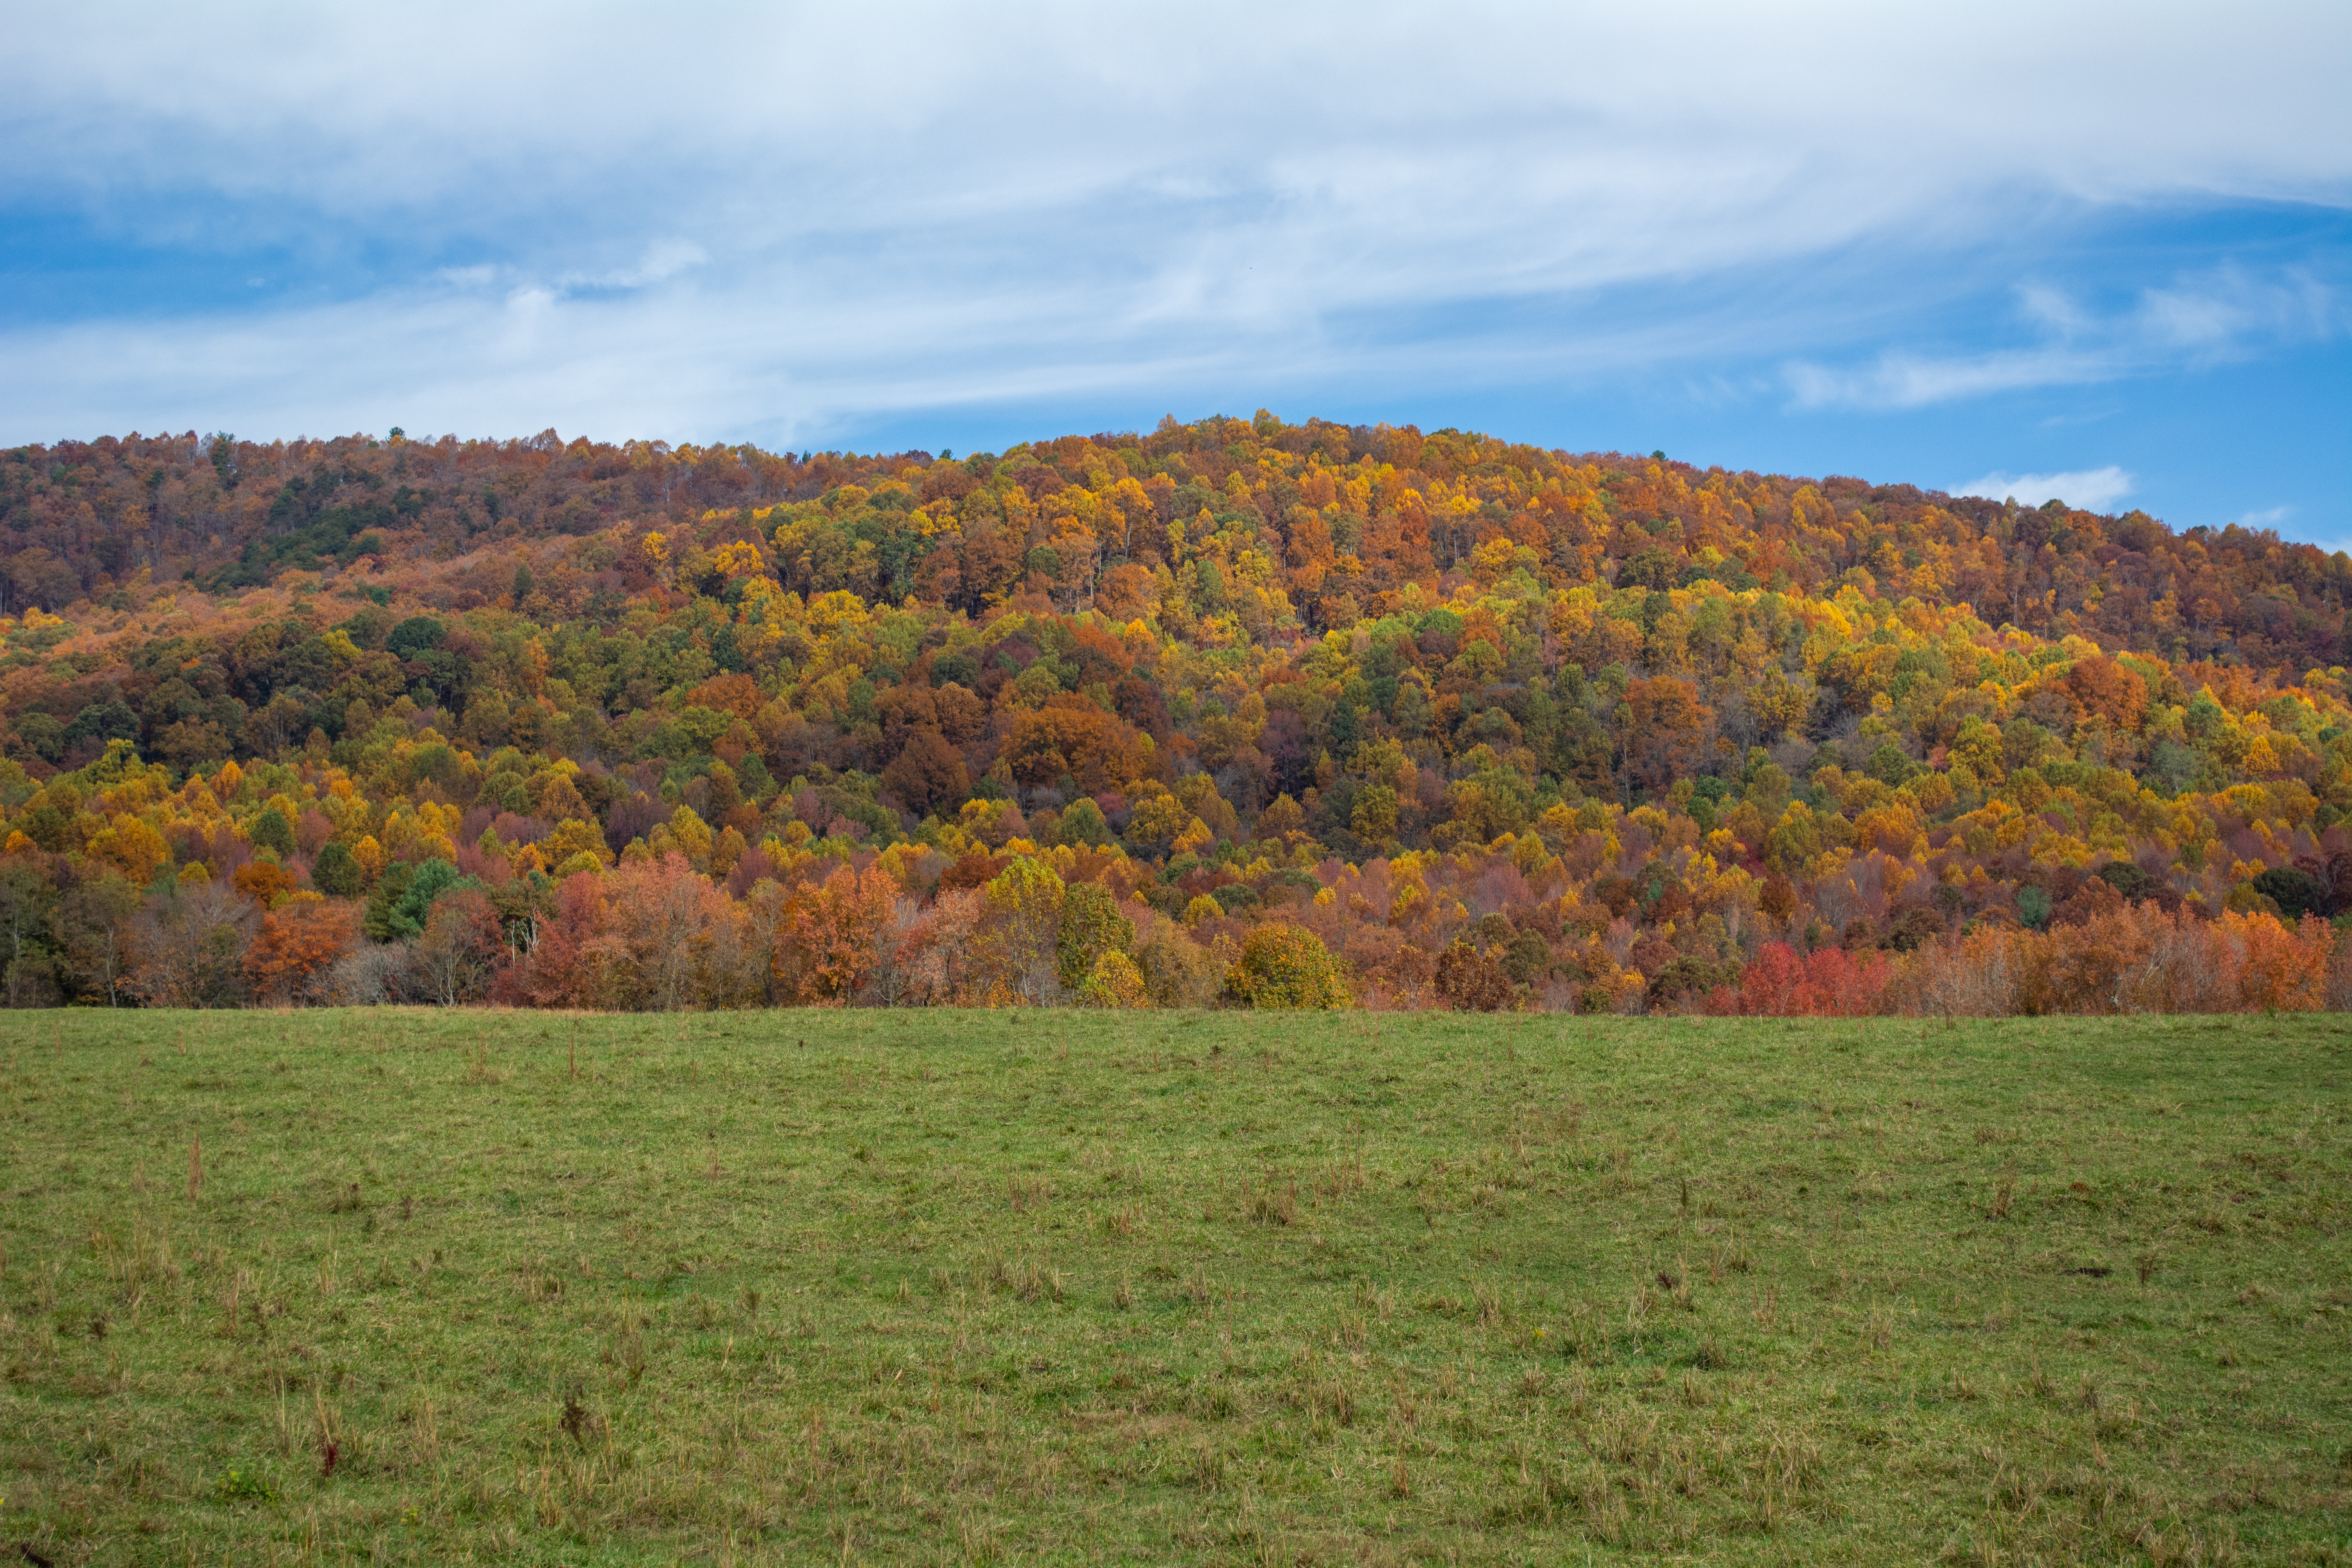
More than half of the landscape has changed. Color is widespread and many locations are approaching their best display. If your trip dates are fixed, areas marked “High Color” can be an excellent choice because they offer strong color with a good chance of continued improvement. A few pockets of green remain visible.
Peak Color: 75%–100%
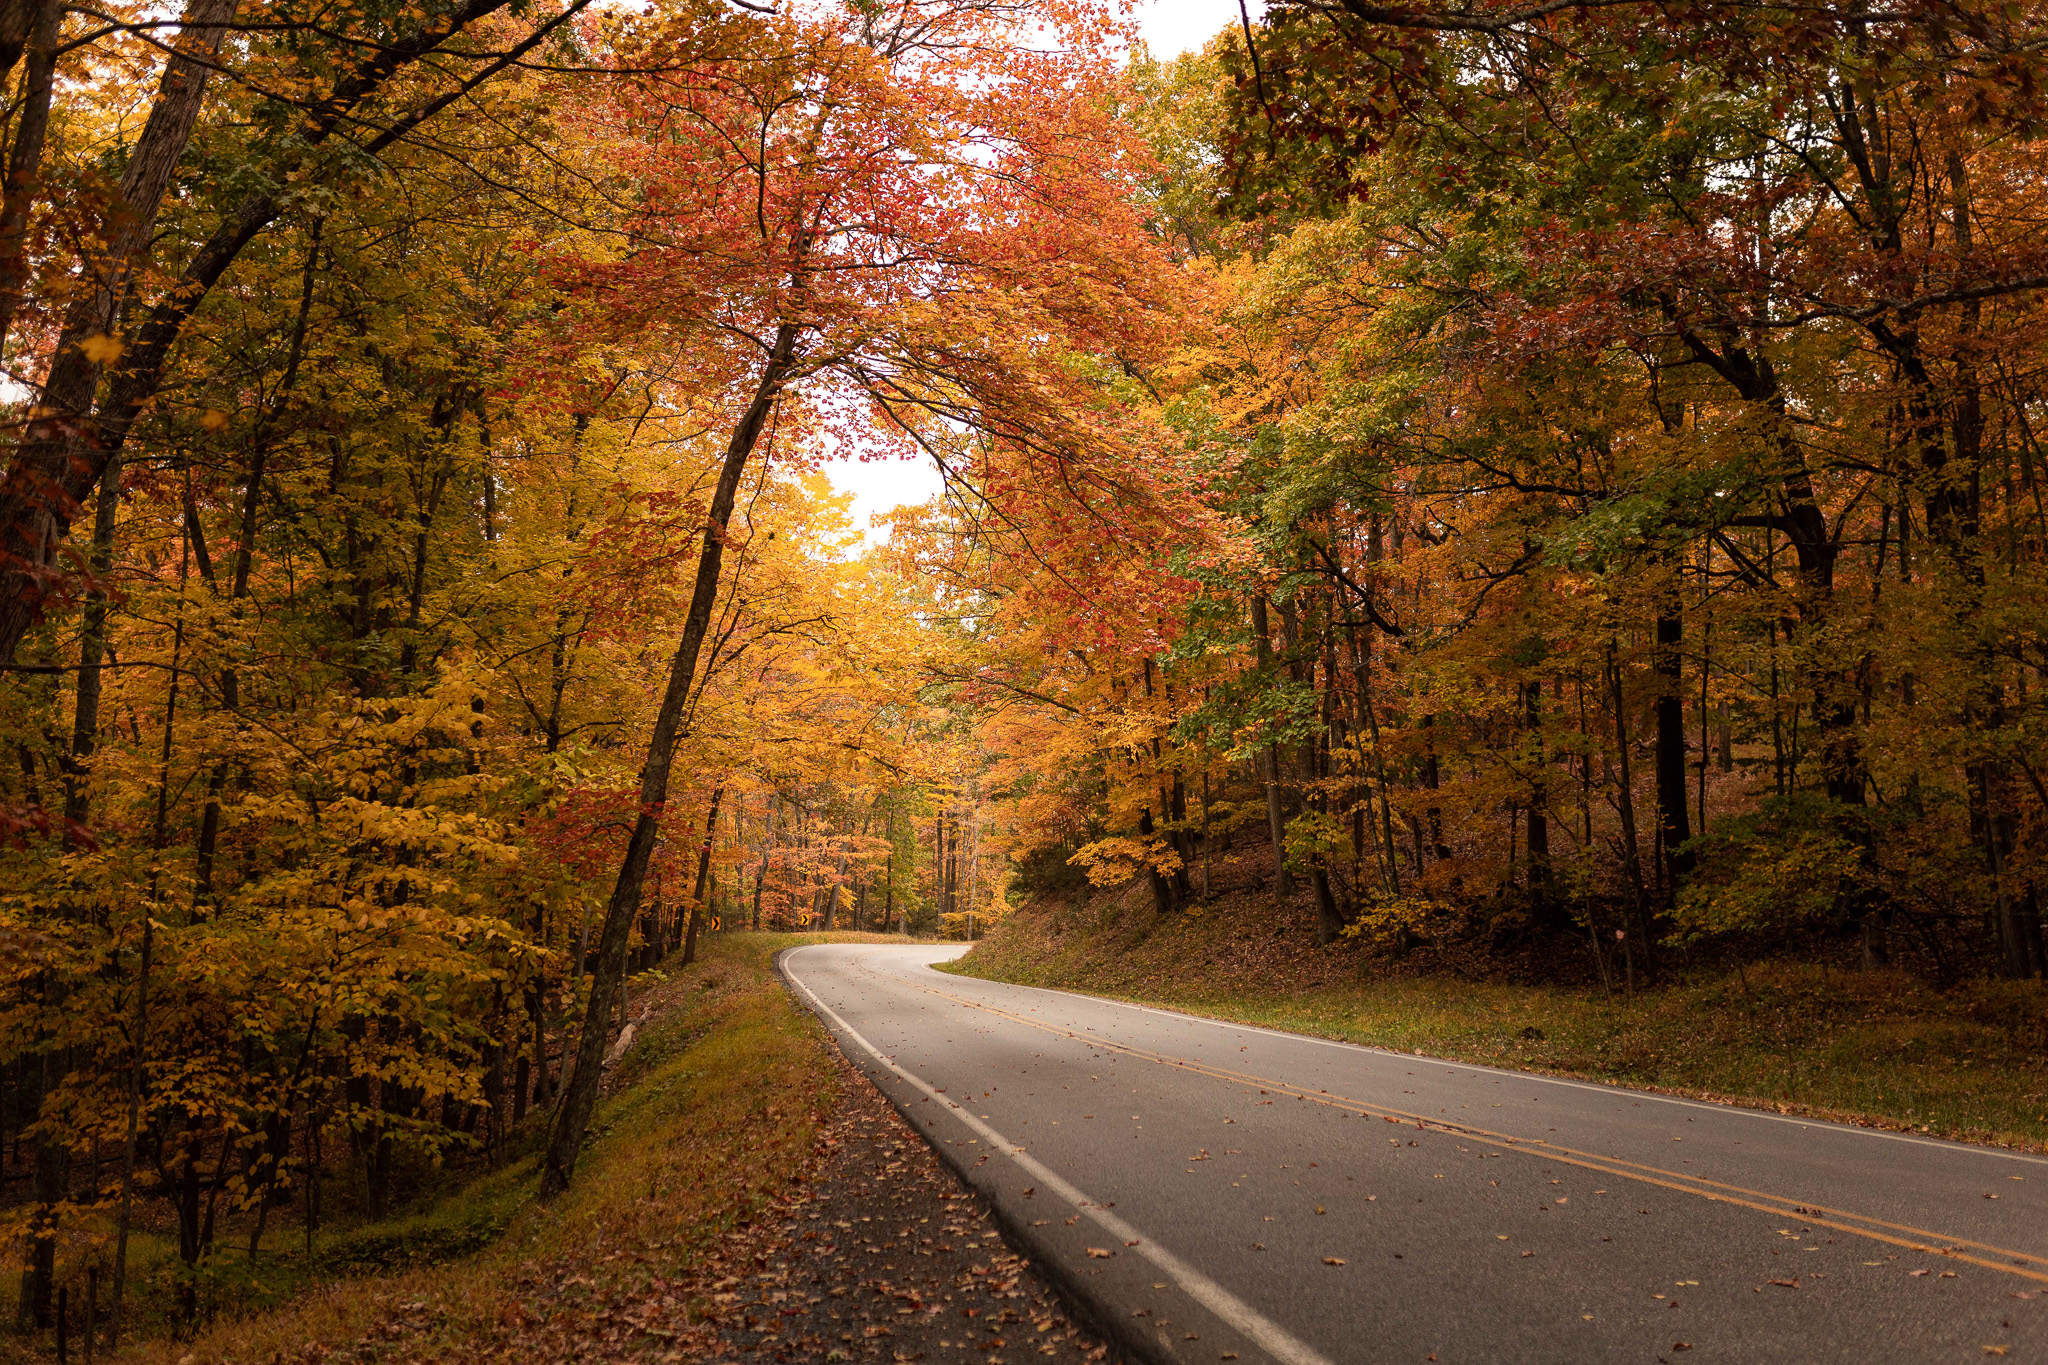
This is the very best that fall has to offer in a given location. Nearly all the trees have changed by this point. In the best seasons and locations, many species reach their strongest vibrance together. Peak can also be less synchronized, however, with different species peaking at different times. Stressed trees may already be browning or dropping leaves. By this point, all trees are ready—or have already started—to shed their leaves.
Past Peak
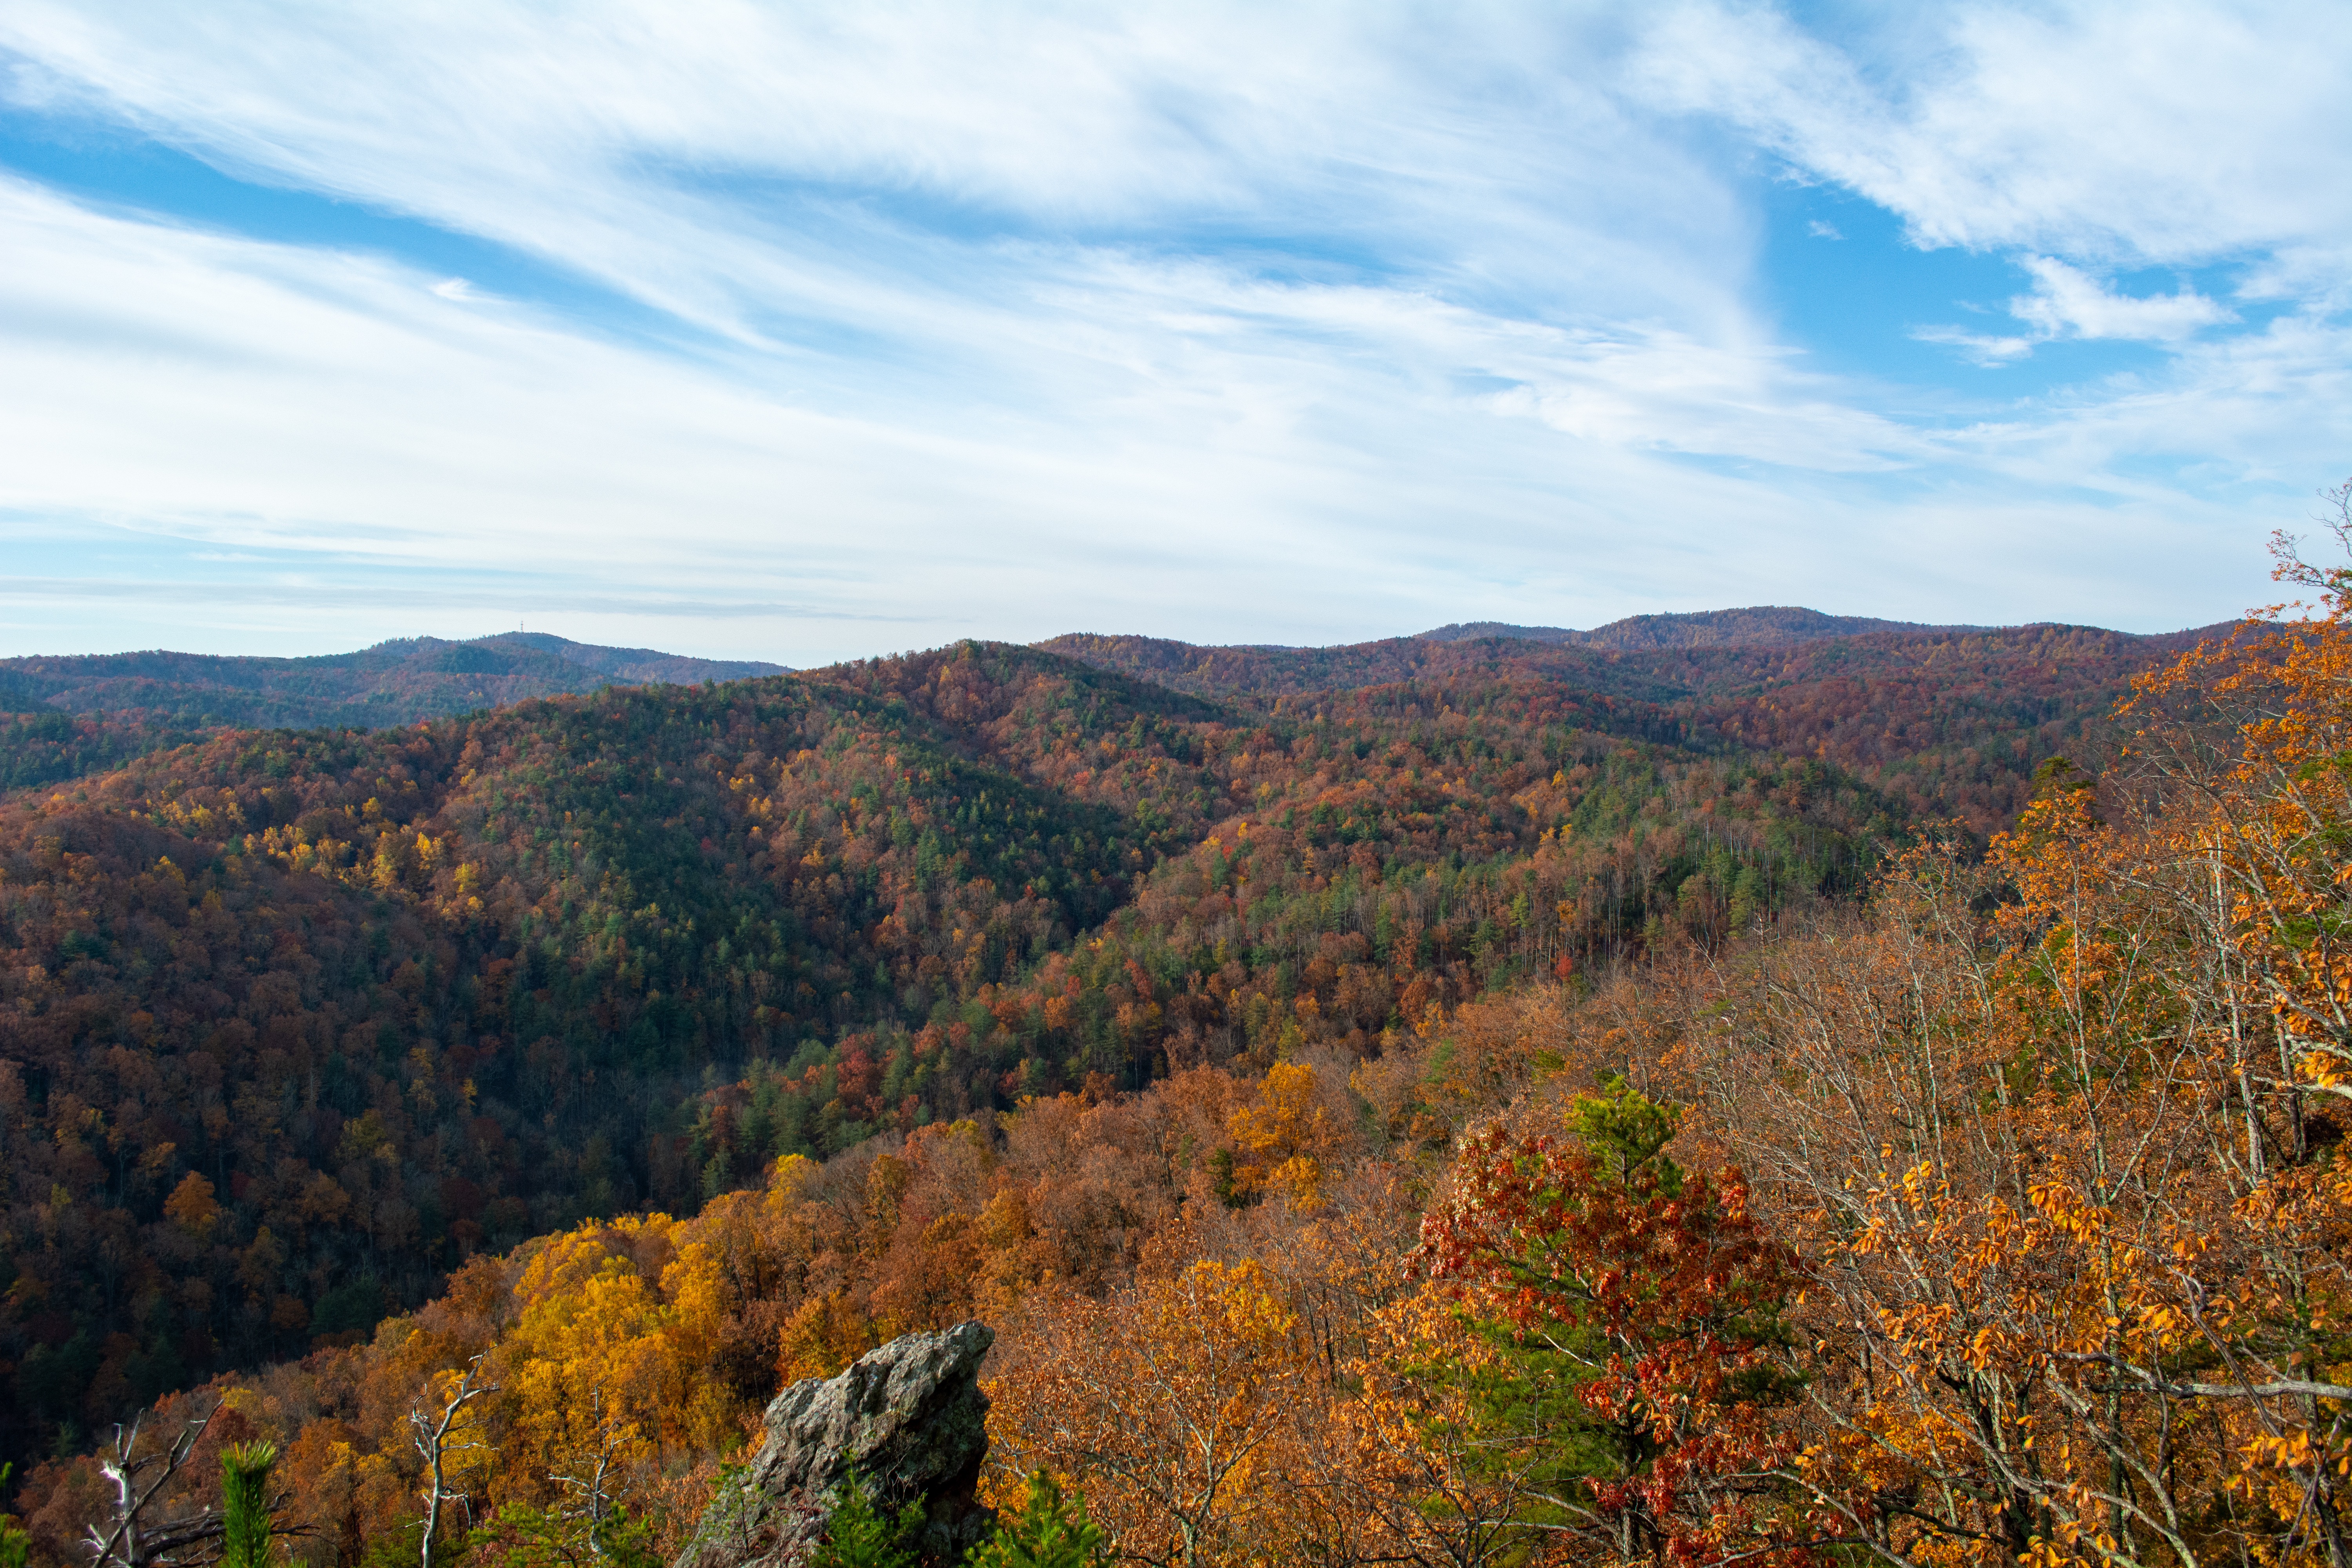
Leaf fall is now the dominant feature. After peak, the landscape begins transitioning toward the grays of “stick season.” The map applies the “Past Peak” label once bare branches become noticeable across the wider landscape. Some individual trees may retain full color for days or even weeks after the area's overall peak.
Plan a Weekend with the Extended Forecast
The date slider lets you look ahead weeks in advance and compare how color is expected to develop. Instead of treating the map as a single snapshot, use it to make a dynamic plan:
- Search for your destination. Enter a city, park, trail area, or street address to center the map on the place you want to visit.
- Check today's category. Note whether the area is at Low, Moderate, High, Peak, or Past Peak color.
- Move the slider to your travel date. Watch how the forecast changes over the next seven days. A location at Moderate Color today may be at High or Peak Color by the weekend.
- Compare nearby elevations and destinations. If your first choice is forecast to be too early or already Past Peak, pan around the map. A nearby valley, ridgeline, or neighboring town may be better timed.
- Turn on Reports. Use recent observations from the ground to confirm what the model is showing before you leave.
Forecasts will continue to evolve as weather changes and new observations arrive, so check again shortly before your trip. Keeping a primary destination and one or two nearby alternatives is the best way to stay flexible.
Other Map Features
Search for a Location
Type a city, park, landmark, or address into the search box and the map will take you there. This is especially useful when matching the forecast to a specific plan, such as an Airbnb stay, scenic drive, or national park hike.
Color Report
When selected in green, Color Report displays the color-status map. This is the default view and shows all of the foliage categories described above.
Peak Timing
When selected in green, Peak Timing displays average peak dates across the country. This layer does not change with the date slider and is not a forecast for a particular season or day. Instead, it shows the average timing of peak color, which ranges from September through November depending on location and elevation.
Reports
When Reports is turned on in green, individual foliage observations appear on the map. We track reports from social media, webcams across the country, and even satellites in space. These observations help us adjust the model as the season progresses and show what people are seeing in the area you are interested in. Do not rely on the forecast alone—check the observations from the ground, too.
Download
The Download button saves a PNG image of the current map extent. Use it to keep a copy of your forecast or share your plans on social media—and feel free to tag Explore Fall!
Ready to Find Your Fall Color?
Open the live Explore Fall map, search for a destination, and move through the 7-day forecast. With the color stages, recent reports, and high-resolution view working together, you can spend less time guessing and more time enjoying autumn at its best.